[ad_1]
Trade between Europe and North America has resumed to normal figures this year following the dampening of both continents’ economies during the worse stages of the COVID-19 pandemic.
The two regions are major trading partners with the United States being the second largest trading partner with the European Union behind China, and seven of the fifteen largest trading partners with the U.S are E.U. members and the United Kingdom.
During the US-EU Summit in Brussels this week, the two partners launched the EU-US Trade and Technology Council (TTC). The partnership is focusing on researching technological improvements to bolster supply chains and further deepen trade relations between their economies.
Demand for container trade has increased dramatically over the course of the year globally, and the transatlantic lane is no different. The shortage of containers has caused the surge in container spot rates. The Freightos Baltic Index (FBX) has reached $5,094 on June 11 from North Europe to East Coast North America, and Drewry’s World Container Index from Rotterdam to New York reached $4,607 on June 17, a 92% increase from the previous year.
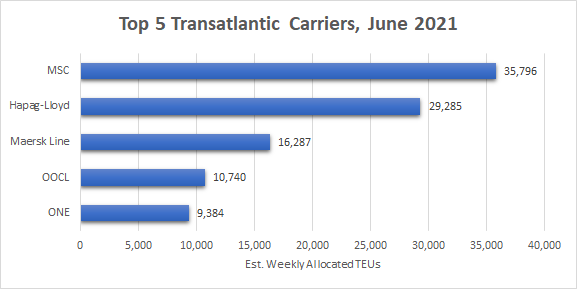
The above chart, built using data from BlueWater Reporting’s Carrier Trade Route Deployment Report, lists the top five carriers operating from North Europe and the Mediterranean to North America by their estimated allocated weekly capacity in TEUs. MSC and Hapag-Lloyd are the largest, with 35,796 TEUs and 29,285 TEUs respectively, followed by Maersk, ONE and OOCL. MSC dominates the capacity from the Mediterranean to North America while Hapag-Lloyd has the greatest capacity originating from North Europe.
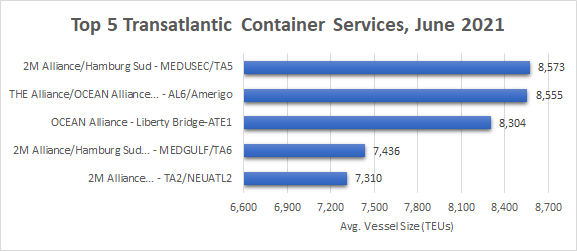
The top five container services along the transatlantic lane by average vessel size are listed above, built using BlueWater Reporting’s Capacity Report from North Europe and Mediterranean to North America. Each of the five services are operated by the three major carrier alliances, with the largest being 2M Alliance’s MEDUSEC/TA5 service with an average vessel size of 8,573 TEUs, followed closely by the joint THE Alliance and OCEAN Alliance AL6/Amerigo service with 8,555 TEUs. Both of those top two services operate from the Mediterranean to North America.
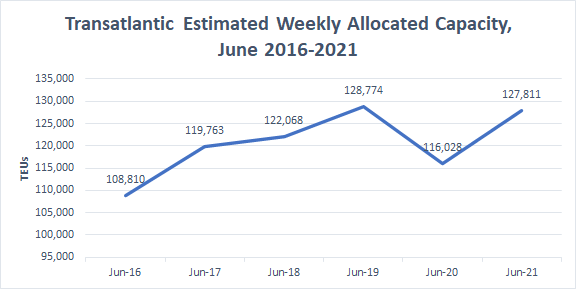
The above chart, also from the Capacity Report, shows the estimated weekly allocated TEUs from the latest week of June year-over-year from 2016. The capacity rose by 18.35 percent from June 2016 to June 2019, 108,810 TEUs to 128,774 TEUs respectively, but dipped to 116,028 TEUs in 2020, mostly caused from the coronavirus pandemic affect on global trade. The capacity has since recovered back closer to pre-pandemic numbers with 127,811 TEUs on the week of June 13, 2021.
Source: Douglas Kingston, BlueWater Reporting
[ad_2]
This article has been posted as is from Source


