

2021 so far has been a ground breaking year for the shipping industry and global Trade flows, as the world recovers from the onset of the Covid pandemic last year. This half year review will use VesselsValue Trade data to delve into some of the reasons for the highs and lows of the last six months, as we witness sky high rates, pent up demand and congestion in the Container and Bulker markets, to sinking rates and weak oil demand in the Tanker market.
Bulkers
While 2021 started in a downtrend for the Bulker market, it rallied throughout the first half of the year, with all vessel sizes eventually achieving decade high time charter rates. The Baltic Dry Index, considered by many economic observers as a leading indicator of economic growth, reached a high of 3418 on 29th June 2021, a level last seen over a decade ago in July 2010.
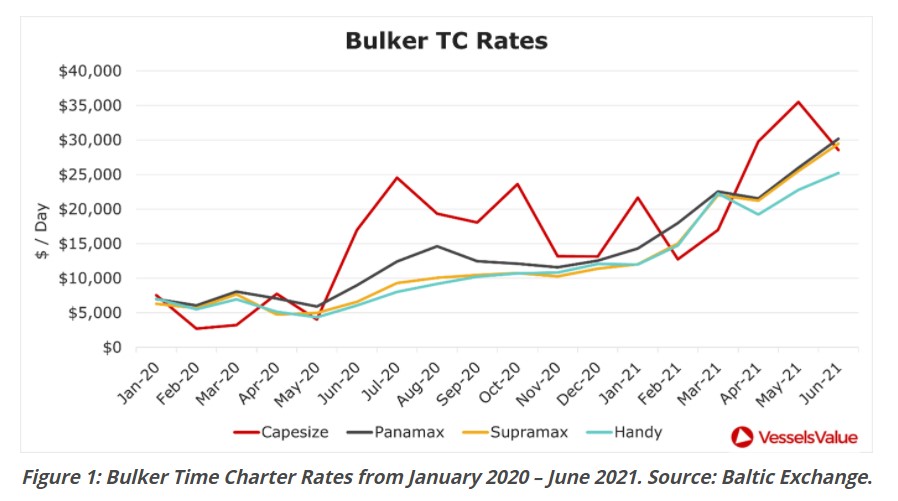
The Capesize market, typically the most volatile, printed a daily index of $44,817 in early May, which was over a 300% increase from mid February’s low of $10,304. The smaller Bulker markets have had smoother but still consistent climbs, ending the first half of the year at their highest daily rates (see Figure 1.)
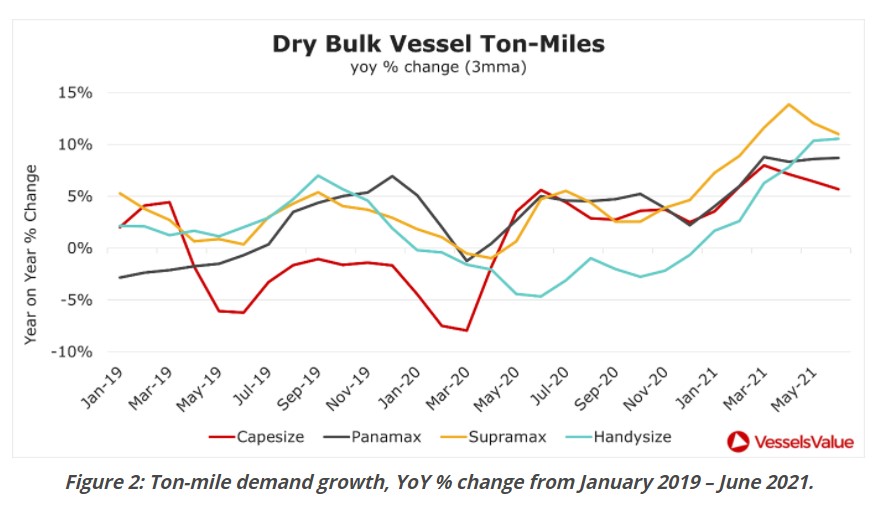
The fundamentals of the Dry Bulk markets in the first six months of 2021 have changed profoundly compared to in the first half of 2020, as illustrated by the shifts in ton-mile utilisation. As is evident from Figure 2, while the Capesize market was seeing year-on-year declines in ton-mile demand of 7-8% at the start of Covid related restrictions last year, ton-mile demand has been running consistently over 5% so far this year. The picture is equally positive across the other Dry Bulk markets, with Supramax vessels recently seeing annual ton-mile growth of over 10%.
Considering the positive ton-mile demand growth, we can look at the commodities which have provided support to the Dry Bulk market over the past 6 months.
Iron Ore
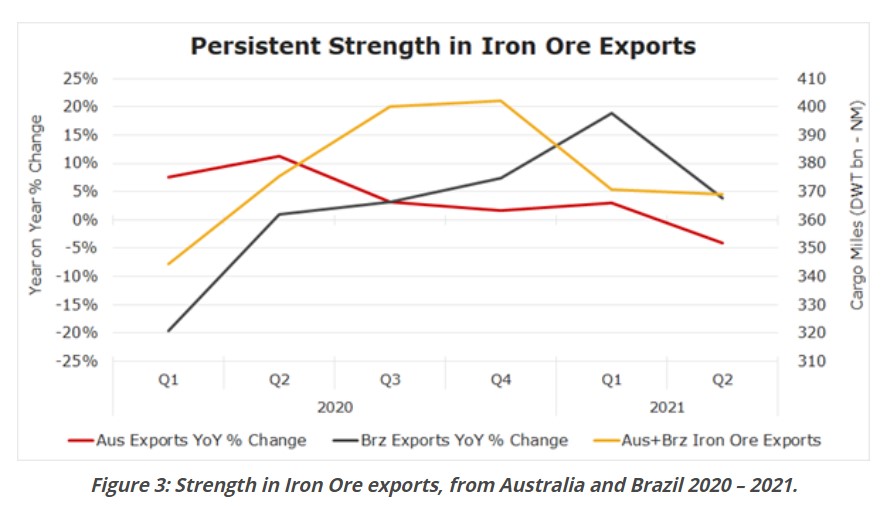
Persistently strong iron ore exports have been critical for the bullish fundamentals of the Capesize markets, as combined Australian and Brazilian exports ran at a rate of just over 20mt higher in the first half of 2021 compared with the same period last year (even if seasonally weaker than the record export volumes in Q4’20). Away from sheer volumes, perhaps the most important factor underpinning the strength of the Capesize market is that all the iron ore export growth over that period has come from Brazil, where loadings ran at 24mt higher than last year more than offsetting a minor drop in Australian exports (see Figure 3). The increase in those fronthaul shipments is causing sharp increases in Capesize laden distances and ballast requirements, leveraging the pure volume’s impact on vessel utilisation.
Coal
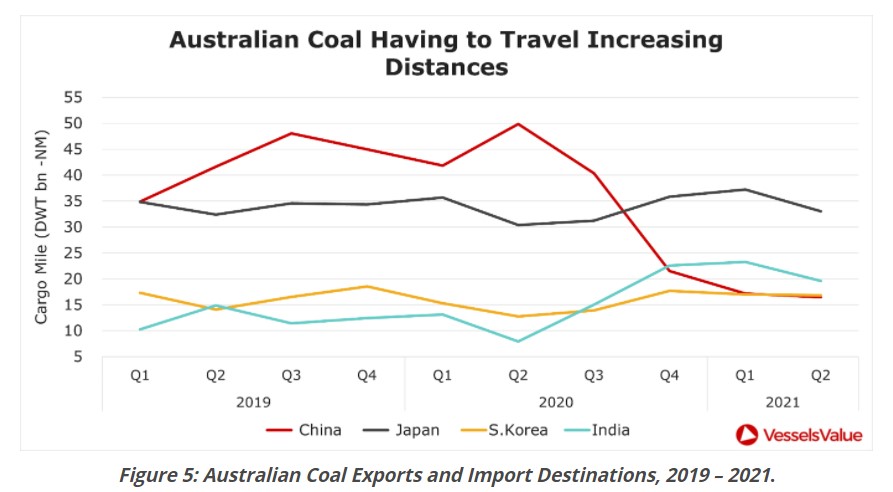
Developments in the thermal coal market have equally been highly supportive for the Dry Bulk market. Geopolitical tensions between China and Australia led to China effectively banning imports of Australian thermal coal since Q3 of last year.
This has led to two significant consequences for the Dry Bulk market, both causing shifts in global trade routes:
- China, the world’s largest importer of coal, has had to source its thermal (and to an extent coking) coal requirements from further afield.
- Australian coal itself has had to be sold to importers that are further afield.
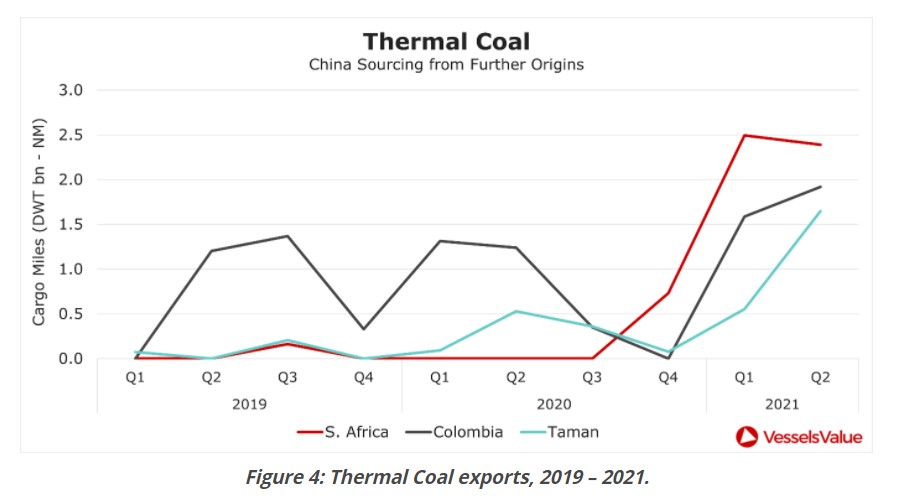
While China has previously imported coal from the Atlantic basin, such imports have largely been based on arbitrage and short lived. But now being unable to take Australian coal, China has become, in the space of a few quarters, a major export destination for producers in South Africa and Colombia. The fastest growing coal port in western Russia, Taman, also now sees China as a backbone destination. These fronthaul trade flows (increasing by 6-7mt per quarter) have large impacts on both the laden and ballast distances, increasing ton-mile utilisation.
While the most impactful in terms of ton-miles, the emergence over the past few quarters of those fronthaul coal trades is not the only consequence of China looking for alternatives to Australian coal. We have also seen coal exports from Russia’s eastern ports shift away from Japan and South Korea and towards China – again a significant increase in ton-mile requirements.
Now that Australian coal is effectively blocked from ports in the South of China, it has had to find outlets elsewhere. Figure 5 below shows that while Australian coal exports to China have dropped by approximately 30mt per quarter since Q2 2020, exports have increased by approximately 15mt to India, 5mt to South Korea and 3mt to Japan. Those are all longer haul destinations than the ports in southern China where it had traditionally been sold.
While the Capesize market has benefited from these shifts, the changing patterns of coal trade flows have impacted the Panamax and smaller Dry Bulk vessels proportionately more.
Looking ahead to the rest of 2021, the main factors which have proved so supportive to the Dry Bulk markets in the first half of the year are likely to persist and could be further accentuated in the seasonally strong Q3 and Q4 periods.
Containers
The first half of 2021 proved a nightmare for shippers faced with sky high box rates and deteriorating liner services, characterized by delays and bottlenecks as more Container ships were held at congested ports and terminals. In contrast, shipowner operators were reaping the rewards as booming demand for vessels and TEU space skyrocketed, resulting in a red hot charter market and record breaking end of year profit forecasts never seen before.
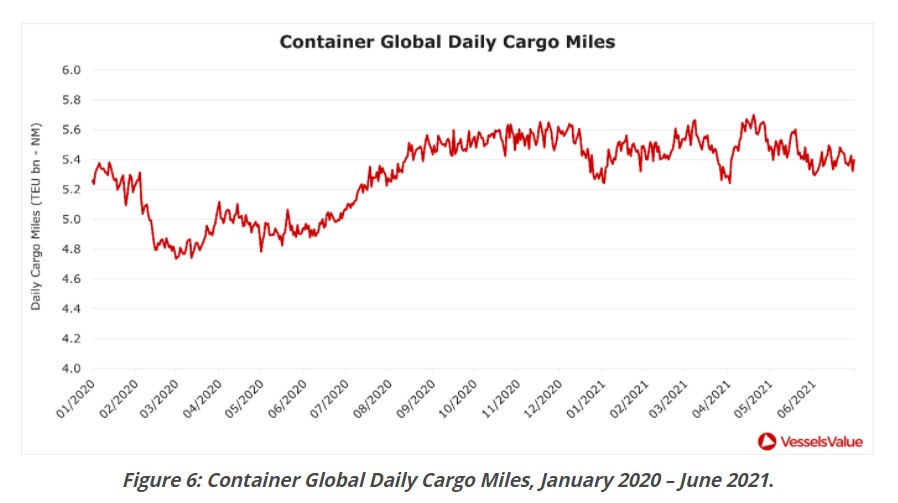
The beaching of the EVER GIVEN (20,124 TEU, Sept 2018, Imabari) in the Suez Canal at the end of March, followed by the Covid outbreak at Yantian port in early June were pivotal moments disrupting world trade. Container global cargo miles dipped by -0.4 billion (Suez) and -0.3 billion (Yantian) respectively in 2021 as per Figure 6. Demand was subsequently more volatile than the latter end of 2020, but a marked improvement versus the first six months of 2020 when the West was decimated by a double dip shock from the pandemic.
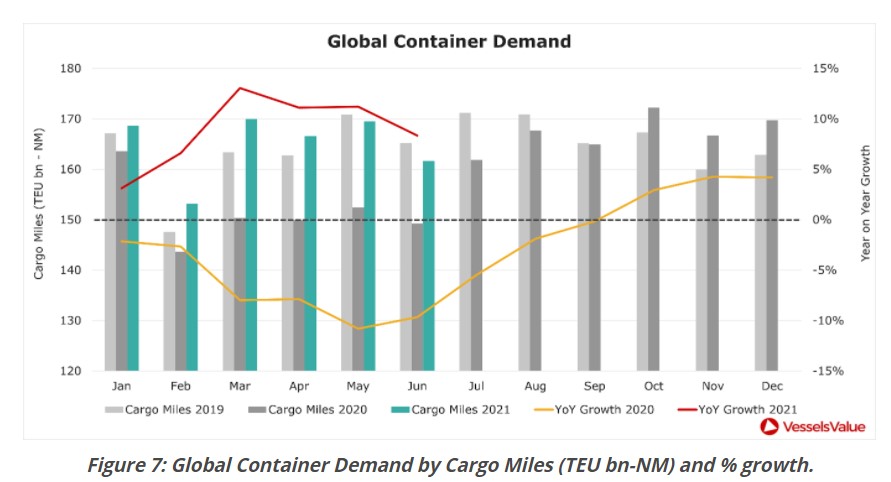
To gain a better understanding of underlying demand, we have compared TEU miles against the pre Covid year of 2019 in Figure 7. January through to April 2021 were clearly strong months as pent up consumer spending on retail goods rebounded (+2.7%). May was relatively similar, then demand softened in June (-2.1%) weighed down by Yantian. The overall difference is just 1.3% in favour of 2021, with year on year growth starting to decline.
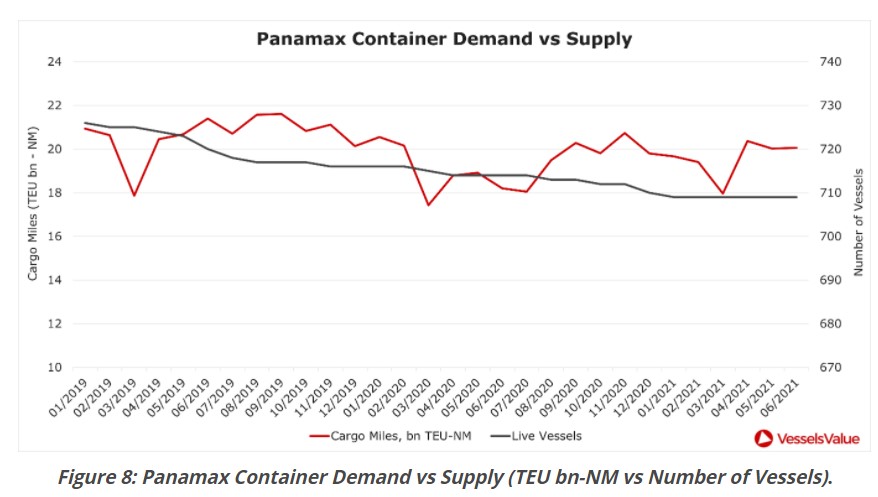
On the supply side, the live ship count has remained relatively stable. Panamax units have held steady throughout at 709 vessels (see Figure 8). This should not be surprising as the idle fleet count for commercially viable ships has been at all time lows, with very few ships available for charter.
Owners basked in a sizzling charter market for the best part of 2021. Initially benefitting larger ships at the start of the year, before cascading down to smaller sizes including Handy and Feedermax from the second quarter. At one point in April, no vessels were open for charter in Europe. By the end of June, Post Panamax rates had increased by an impressive 107%. Charterers responded by renegotiating extensions and continued to increase vessel speeds to counter rising hire costs (see Figure 9). This is an interesting metric to follow for deeper insights into trade demand, in addition to VesselsValue’s historical time series congestion tool.
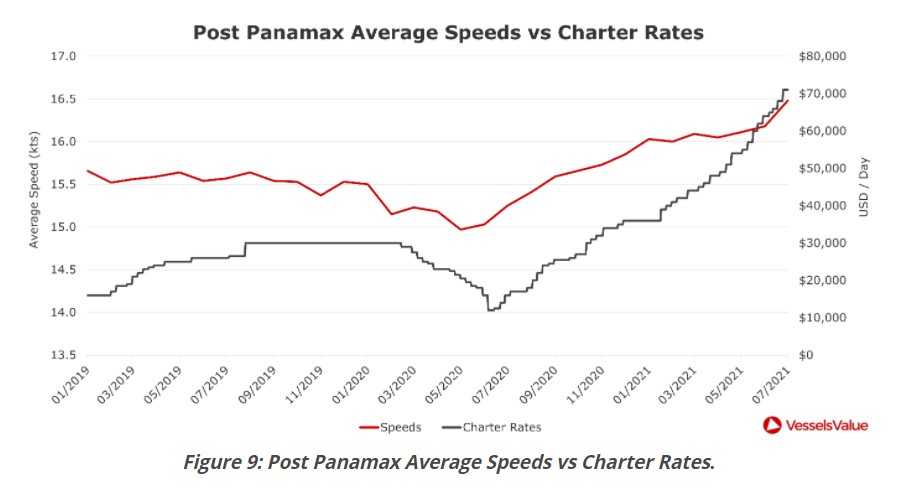
At the halfway point, Container cargo mile demand so far this year has shown volatility due to unprecedented congestion from the Suez blockage and Yantian outbreak causing global bottlenecks. Supply of tonnage became extremely tight for all container sizes, with rates continuing to firm upwards reaching new highs. Shipowner operators received a once in a lifetime windfall from the global pandemic, as clogged up ports and terminals increased demand for their ships and services.
Looking forward to the second half, underlying demand should firm as we approach peak season based on strong US retail sales. However major headwinds for carriers are to be expected if Biden signs an executive order urging the FMC to combat unfair competition practices.
Tankers
Whilst other markets have experienced an incredibly strong first half of 2021, with staggering Container and firming Bulker earnings, both the Clean and Crude Tanker markets have had a very poor start in comparison, due to the impacts of Covid catching up on the sector. This is in stark contrast to the peaks seen in Tanker earnings across the first half of last year when other ship types were struggling.
Crude Tankers
Last year’s floating storage glut which saw Crude Tanker rates skyrocket in 2020, began to unwind when production cuts were implemented by OPEC+ and the contango market finally settled. By the end of January this year, just 3.86% of Crude Tankers were being used as floating storage, with this number remaining relatively stable throughout the first two quarters of 2021. This was under half the number which were in floating storage when the peak was seen a year ago in June 2020, when over 9% of Crude Tankers were being used as floating storage.
As a result of this downturn in floating storage, coupled with a dramatic reduction in demand for oil products, Crude Tanker rates this year so far have been significantly lower compared to last year. VLCC rates have been particularly weak, dropping to below OPEX in January, reaching a low of $-11,000 USD per day in mid March, which is over a 2000% YoY decline when compared to the same period in 2020.
Due to Covid’s impact on international and domestic travel, world oil demand fell considerably last year, with a prolonged effect into 2021 as many countries have seen a resurgence in the virus and further lockdowns. India, a significant importer of crude oil ranking third place for the highest cargo miles over the past year, has witnessed a lull in imports this year as a surge in Covid cases slows down economic activity. Between the start of April and the end of June, cargo miles were reduced by 30%, showing how sensitive crude oil demand is to restrictions associated with Covid cases.
Figure 10 shows Crude Tanker cargo miles in the first two quarters of 2020 and 2021. Cargo miles combine actual distances sailed by each vessel and estimates of cargo volumes to indicate the true demand for vessels.
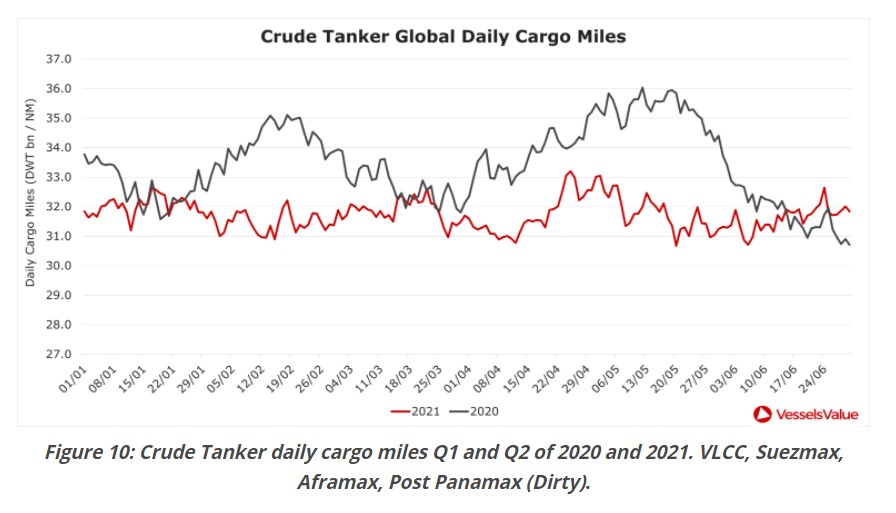
This year, Crude Tanker cargo miles have stayed almost consistently below cargo miles across the same period last year. At the lowest point in May 2021, global cargo miles were just 30.67 DWT bn/NM, which was 17% lower than at the same point in 2020. More recently since the end of May this year, we have seen a slight uptick in demand as global cargo miles have surpassed those seen in June last year. This is a positive sign, but demand levels are still a long way off those seen in 2019 and the start of 2020, and fleet growth continues, causing further imbalance. See Figure 11 for YoY Crude Tanker demand vs supply growth over the past year, showing how cargo mile growth has stayed consistently negative.
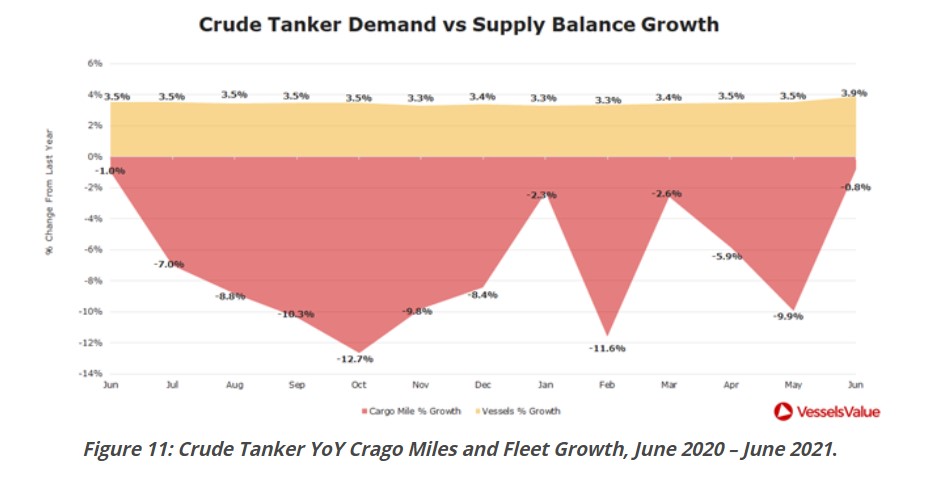
Low rates will continue to be particularly concerning for the Crude Tanker market as we enter Q3, especially coupled with uncertainty for future demand and continued vessel orders. It is expected that global oil demand will rebound by 2022, but we are unlikely to witness any substantial signs of recovery this year and the uncertainty of global oil supply and prices could again unsettle the Crude Tanker market.
Clean Tankers
Clean Tankers have also been suffering in 2021 due to continuous low demand for fuels. As Covid has led to reduced consumption of crude oil, less clean products are being produced and the utilisation of clean product tankers has reduced overall. This means product tanker earnings so far this year have remained weak when compared to 2019 and 2020 rates. After crashing from the exploding rates seen a year ago, both Aframax and Suezmax have experienced periods where earnings were below OPEX, meaning rates for these types were not even covering vessel expenses. A modest tightening of rates was seen for Long Range tankers when the Suez Canal blockage happened in March, but rates soon decreased again into April and May when congestion cleared.
Alongside refining cuts and manufacturing taking a hit, international travel is still at a standstill as countries battle at different rates to vaccinate populations, meaning jet fuel consumption remains at an all time low.
Despite all this, cargo mile demand data is hinting at a slightly more positive recovery than seen in the Crude Tanker market. Demand has been supported by Covid recovery, especially in Asian manufacturing markets, and by the increasing use of gasoline and diesel, as many countries have resumed travel internally since easing lockdowns. When combining LR and MR cargo miles, we can see that so far this year there have been periods where cargo miles have sat higher than last year over the same period, especially since May.
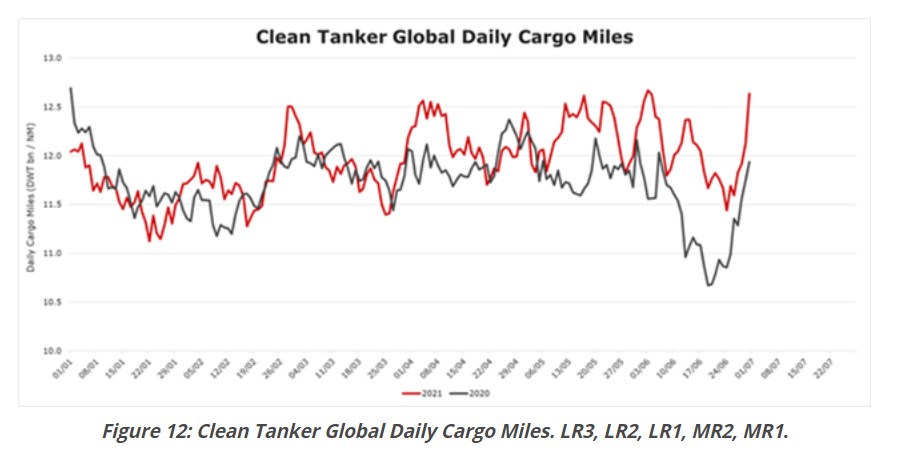
When looking at both types individually, MR demand has grown at a faster pace than LR demand this year and in the past 3 months has at times exceeded cargo miles seen in 2019, pre pandemic. This is a good sign for MR demand. Figure 13 shows MR tanker global daily cargo miles since 2020.
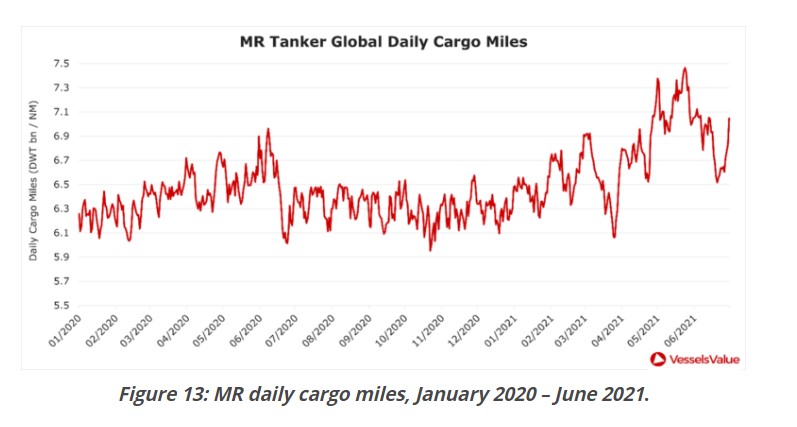
MR cargo mile growth over the past 6 months has been driven by economic recovery in the East and the resurgence of manufacturing, with this vessel type typically running shorter regional voyages. In the past 6 months, MR trade flows into South East Asia alone made up over 15% of total cargo volumes, followed by 8% into the East China Sea region. Figure 14 shows total cargo miles, journey counts and cargo volumes for MR vessels.

Despite these glimmers of hope and demand in Asia picking up, demand for oil products from the US and Europe are still lagging. Ongoing supply in the clean market is also holding up, which could lead to oversupply and further soften demand, so the clean tanker market is not out of the woods yet. Around 95 clean tankers were delivered last year, compared to 53 so far in the first half of 2021, so vessels deliveries are not showing signs of slowing down.
Consumers will likely continue to exert caution when it comes to resuming international leisure and business travel, meaning clean and Crude Tanker demand is unlikely to reach the same pre Covid level in the second half of this year. However, the success of vaccination programmes and economies seeing growth is a promising sign. Some improvement can also be seen in values and sale prices, suggesting that some are banking on a recovery soon, optimistically expecting rates to improve and demand to strengthen.
Conclusion
The first six months of 2021 are a clear indication of how demand for goods and availability of tonnage directly correlates with vessel earnings. The Bulker market has made a strong recovery in 2021 so far, as demand for Dry Bulk materials has recovered post Covid, resulting in strong rates. Trade flows have also shifted this year due to geopolitical tensions between Australia and China, lending to longer legs, heightened cargo miles and tightening vessel availability. The Container market has also been booming in the first two quarters, with pent up demand and a lack of available vessels leading to decade high rates. Both the Bulker and Container markets are expected to continue this winning streak into the second half of the year, as we enter peak seasons for both sectors.
The Tanker market, however, has experienced a less fruitful year, after the temporary success it felt in Q2 2020 came crashing down and is yet to improve. Tanker rates have been at all time lows as demand for crude and oil products is still reduced due to the impacts of the pandemic. Tanker demand is expected to lift as the world adjusts to Covid, with significant recovery in demand expected by the end of 2022, however, some market participants expect a recovery before then, as we see an optimistic firming in sale prices and values.
VesselsValue data as of July 2021.
Source: VesselsValue