
“ The maritime industry will go through a period of rapid energy and technology transition that will have a more significant impact on costs, asset values and earning capacity than many earlier transitions,” Linda Sigrid Hammer, Principal Consultant, Environment Advisory in Maritime at DNV and lead author of Maritime Forecast to 2050 reflects.
Driving the ongoing maritime energy transition
“Regulatory focus on progressively stricter limits on greenhouse gas (GHG) emissions is increasing the compliance challenge over vessel lifecycles as carbon-reduction trajectories rapidly head towards zero,” Hammer continues. “Stricter carbon requirements from financiers and cargo owners are adding to this pressure.”
While the regulatory milestones illustrated in Figure 1 are from 2021 onwards, the energy transition in shipping is underway. Nearly an eighth (12%) of current newbuilds are ordered with alternative fuel systems, double the percentage reported in the 2019 edition of DNV’s Maritime Forecast to 2050.

Figure 1: Main regulatory milestones of possible policy measures
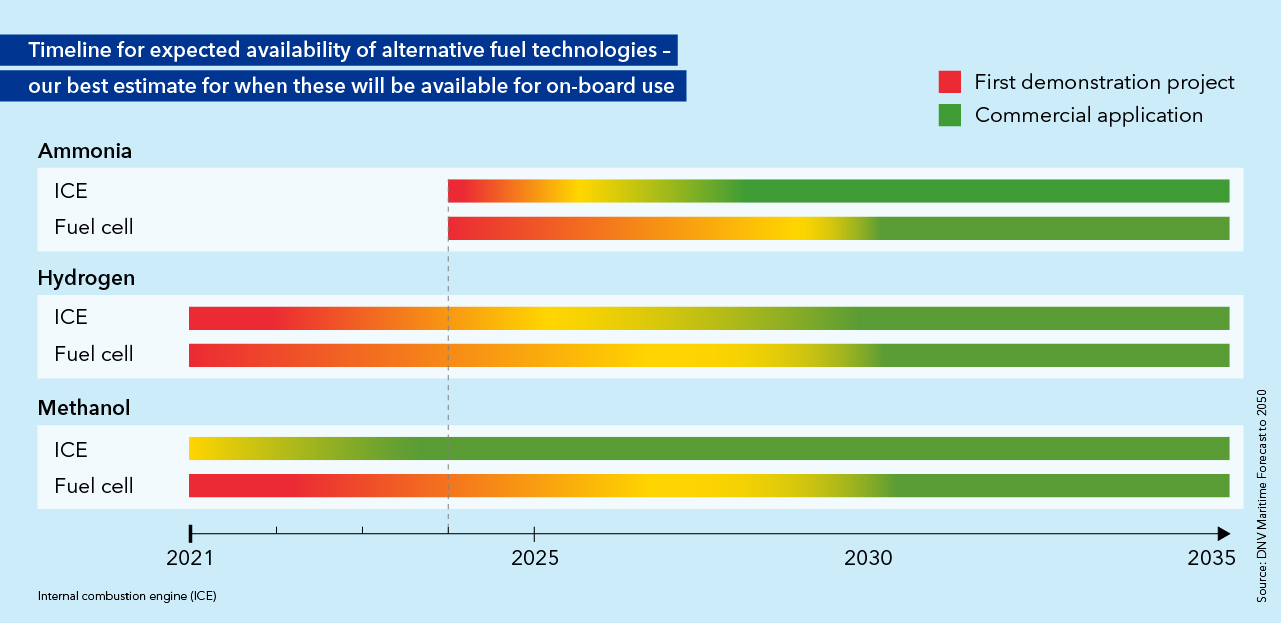
Though liquefied natural gas (LNG) dominates current use of alternative fuels, 10 methanol powered ships are in operation and 28 are on order (as of 1 September 2021). Hydrogen is in limited use for some smaller vessels such as ferries. This operating experience will help to identify and solve issues, such as storage space and temperature, for scaling hydrogen use for larger ships. DNV estimates that further demonstration projects with hydrogen, and with ammonia, will open new pathways to zero-carbon vessels by 2025, with commercial use in a wider range of ship types and sizes by the late 2020s.
Which fuel systems can facilitate the use of carbon-neutral fuels?
When it comes to fuel systems, fuel cells for maritime use are being researched and developed, but are a much less mature technology than internal combustion engines for fuelling ships, whatever the fuel type. Other emerging technologies include onboard carbon capture and storage (CCS) to decarbonize vessel emissions. CCS is a mature technology for onshore use and can play an important role in meeting maritime emissions targets in the years before zero-carbon fuels become viable, according to Norway’s SINTEF, a leading independent research organization. SINTEF Energy Research is leading the “CCShip” joint-industry project researching how to make CCS more cost effective for both near- and long-term deployment on ships.
In a glimpse of other, longer-term, fuel futures, Sweden’s Wallenius Marine and Alfa Laval are to jointly develop and realize the former’s Oceanbird “wing sail” technology for fully wind-powered vessel propulsion.

Figure 2: Estimated timelines for uptake of ammonia, hydrogen and methanol fuel technologies for ships
Choosing fuels for long-term competitiveness
Recognizing the accelerating shift, even for deep-sea commercial tonnage, this year’s Maritime Forecast to 2050 offers practical advice and solutions to help keep newbuilds and the existing fleet competitive over their lifecycles.
To achieve this, DNV uses an updated carbon-risk framework – the DNV FuelPath Model – to support decision-making as part of retaining a vessel’s fuel flexibility to deal with an uncertain and much more diverse fuel future. Fuel is the largest operational cost component for shipping and the biggest driver of emissions reductions.
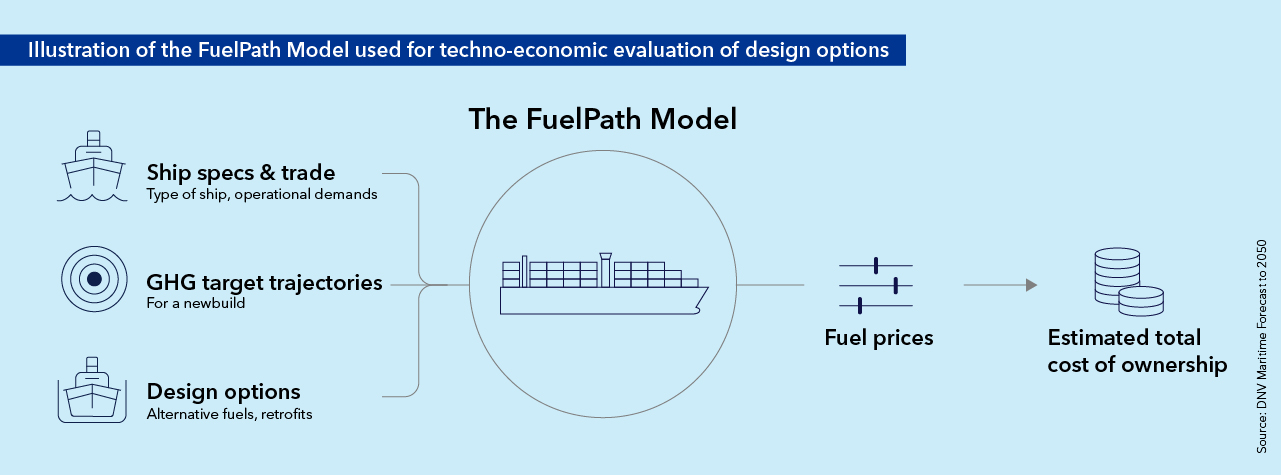
Specifically designed to allow detailed assessments of fuel flexibility and Fuel Ready solutions, the FuelPath Model framework is used for the techno-economic evaluation of fuel and energy-efficiency strategies, and their impacts on ship design. Correctly assessing the technology, fuel and energy production/infrastructure landscape can enable owners to stay within carbon reduction trajectories.

Figure 3: Illustration of DNV’s FuelPath Model used for techno-economic evaluation of design options
DNV’s Maritime Forecast to 2050 applies the FuelPath Model to investigate different fuel and technology options to reveal the most cost-efficient fuel ready and fuel flexible design options for a Newcastlemax bulk carrier weighing 210k deadweight tonnes as a case study under a variety of future fuel prices and GHG target trajectories. The robustness of fuel and technology options are evaluated by altering key variables (fuel and carbon prices, conversion capital expenditure (such as CAPEX, etc.).
What DNV’s FuelPath Model shows
The findings of this modelling are available in Maritime Forecast to 2050 and will be presented in detail in a companion Maritime Impact article. In high-level view, and with safety underpinning all design decisions, the findings:
• Show the potential advantages of choosing design options underpinned by safety considerations and enhancing a vessel’s fuel flexibility. This strategy increases resilience and the ability to remain compliant and competitive as regulations and stakeholder requirements tighten. Allocating sufficient space for fuel storage while minimizing loss of carrying capacity and without compromising safety are the main design challenges.
• Indicate that implementing design features that balance these goals at the newbuild stage can eliminate showstoppers and reduce time and costs at the conversion yard.
• Illustrate the value of incorporating basic measures to accommodate fuel flexibility in the newbuild specification, so that the ship is prepared for several possible fuel transitions.
Cost: Shipping decarbonization CAPEX could reach USD 800 billion by 2050
Whatever fuels emerge as the dominant choices for decarbonizing various vessel types by mid-century, the total capital expenditure (CAPEX) for the necessary onboard technologies will be huge.
In an outlook on fleet technology investments and energy supply, Maritime Forecast to 2050 predicts that over the period 2020–2050, such CAPEX could range from USD 250–800 billion (bn), depending on GHG reduction ambitions. It estimates peak investment in any year ranging from USB 20–60 bn.
The forecast also indicates the extent to which shipping decarbonization will depend on accessing enough of the right fuels and the clean energy to produce them. In doing so, it illustrates how decarbonizing the sector is an integral part of the broader energy and fuel production landscape.
Power: Will there be enough clean electricity to produce all the e-fuels ships need?
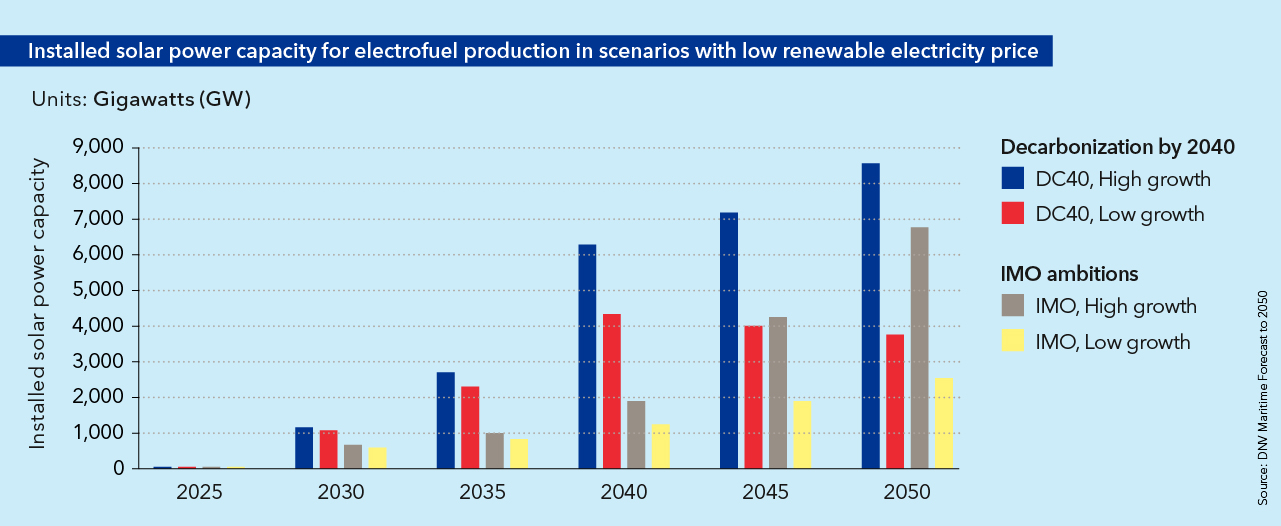
Purely for illustrative purposes, Maritime Forecast to 2050 estimates that producing sufficient e-fuels for shipping could require as much as 8,000 gigawatts (GW) of installed solar photovoltaic (PV) power capacity globally in mid-century (Figure 4) if this was the only type of renewable energy used for this purpose. This compares with installed solar PV capacity of around 600 GW in 2019, while DNV’s latest Energy Transition Outlook (ETO) forecasts 1,000 GW in 2022 and around 10,000 GW in 2050.

Figure 4: Required installed solar power capacity (for illustration only) for production of e-fuel in four scenarios with low renewable electricity price. “High” and “low” refer to 180% and 25% respectively in total growth in seaborne trade demand between 2020 and 2050. IMO describes a decarbonization pathway where shipping achieves ambitions set in the Initial IMO GHG strategy – aiming for 50% GHG reductions by 2050. DC40 is a highly ambitious pathway, where shipping achieves decarbonization by 2040.
“While other types of clean electricity would also be used for making e-fuels, the solar PV example suggests that indirect renewable power demands generated by shipping is potentially very high and that the transition to new fuels may be constrained by capacity issues,” says Hammer.
CCS: Will there be enough carbon capture and storage capacity to produce all the blue fuels ships will need?
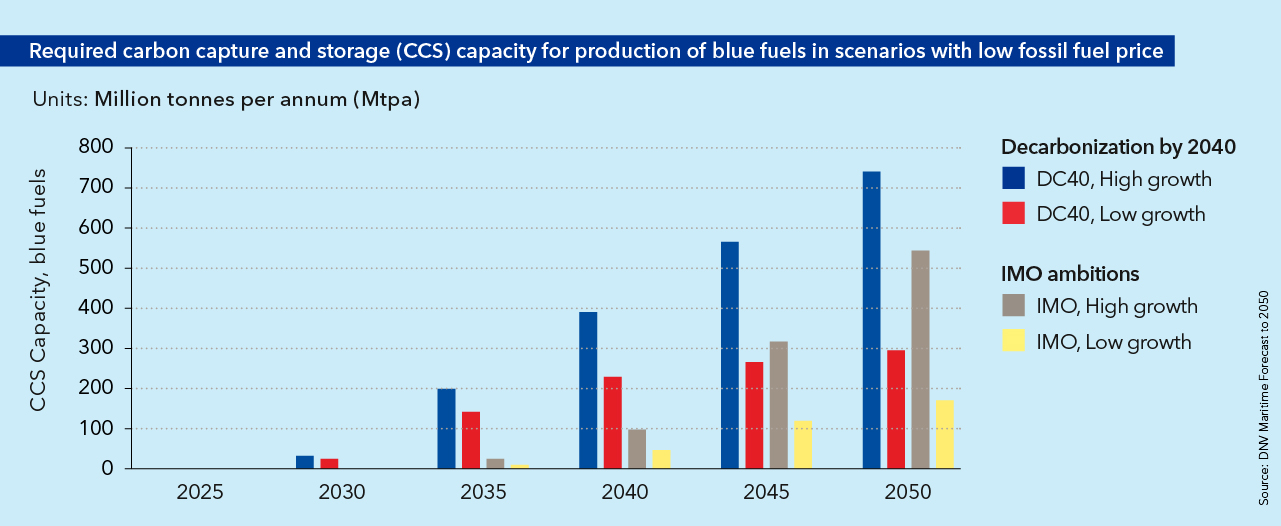
Similarly, Maritime Forecast to 2050 predicts that ensuring sufficient blue fuels for shipping could require up to 750 million tonnes per annum (Mtpa) of carbon capture and storage (CCS) capacity by mid-century (Figure 5).
For comparison, DNV’s latest ETO estimates that the global capacity of CCS for capturing carbon dioxide from SMR (steam methane reforming) will be 885 Mtpa in 2050. The IEA’s current Sustainable Development Scenario sees a global carbon capture capacity of around 6,000 Mtpa being required in 2050 to meet sustainability goals, including fulfilling the Paris Agreement on mitigating global warming.

Figure 5: Required carbon capture and storage capacity (for illustration only) for production of blue fuels in four scenarios with low fossil fuel prices. “High” and “low” refer to 180% and 25% respectively in total growth in seaborne trade demand between 2020 and 2050. IMO describes a decarbonization pathway where shipping achieves ambitions set in the Initial IMO GHG strategy – aiming for 50% GHG reductions by 2050. DC40 is a highly ambitious pathway, where shipping achieves decarbonization by 2040.
“Our modelling of the required scale of energy supply indicates that increased efforts are needed to develop and implement the mechanisms required to tackle these and other such barriers if shipping is to transition in a timely manner,” concludes Hammer. “It also highlights to policymakers how shipowners are not passive bystanders in the global energy transition and that a wider collaborative effort is needed to meet climate goals.”
Summing up, Hammer says: “In previous transitions in shipping, every ship made the same transition. The coming transition is different because, and for the first time, the global fleet will probably not all transition to the same fuel. Our latest Maritime Forecast to 2050 adds to, extends and refines the insights that our modelling in recent years has provided to optimize the fuel and design decisions that shipowners are being confronted with. These insights help to plan how to remain competitive come what may in the energy transition.”
Source: DNV https://www.dnv.com/expert-story/maritime-impact/Charting-practical-paths-to-comply-with-carbon-reduction-trajectories.html?utm_campaign=MA_21Q3_ART_IND_356_MF%20to%202050%20-%20General%20findings&utm_medium=email&utm_source=Eloqua