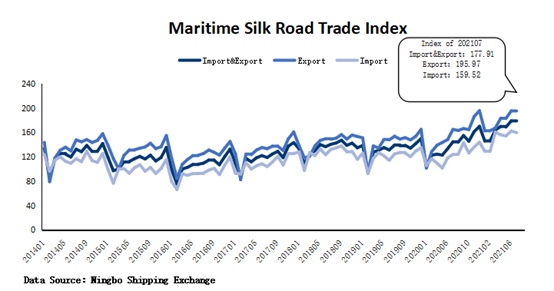

In July 2021, the Maritime Silk Road Trade Index (STI) released by the Ningbo Shipping Exchange showed that the import and export trade index was 177.91 points,down 0.50% from the previous month and up 23.20% year-on-year; the export trade index was 195.97 points,up 0.44% from the previous month,an increase of 18.95% year-on-year;the import trade index was 159.52 points,down 1.66% month-on-month and up 28.96% year-on-year.

From January to June, China total import and export trade value was US$2,781.6 billion,a year-on-year increase of 37.1%.The total export trade value was US$1,519.3 billion,a year-on-year increase of 38.3%;the total import trade value was US$1,262.3 billion,a year-on-year increase of 35.6%.
China’s trade with continents
From January to July , the import and export trade value between China and Asia was US$1,669.1 billion, up 31.9% year-on-year, accounting for 50.7% of China’s total import and export value. The export trade value was 856.1 billion U.S. dollars, up 32.8% year-on-year; the import trade value was 813.0 billion U.S. dollars, up 31.0% year-on-year.
From January to July , the import and export trade value between China and Europe was US$642.1 billion, up 34.2% year-on-year, accounting for 19.5% of China’s total import and export value. The export trade value was 372.7 billion U.S. dollars, up 32.7% year-on-year; the import trade value was 269.5 billion U.S. dollars, up 36.5% year-on-year.

From January to July , the import and export trade value between China and Africa was US$138.5 billion, up 39.9% year-on-year, accounting for 4.2% of China’s total import and export value. The export trade value was 80.0 billion U.S. dollars, up 36.4% year-on-year; the import trade value was 58.5 billion U.S. dollars, up 45.0% year-on-year.
From January to July , the import and export trade value between China and North America was US$449.6 billion, a year-on-year increase of 39.7%, accounting for 13.7% of China’s total import and export value. The export trade value was 329.9 billion U.S. dollars, up 36.4% year-on-year; the import trade value was 119.7 billion U.S. dollars, up 49.5% year-on-year.
From January to July , the import and export trade value between China and Latin America was US$243.1 billion, a year-on-year increase of 45.5%, accounting for 7.4% of China’s total import and export value. The export trade value was 120.6 billion U.S. dollars, up 58.6% year-on-year; the import trade value was 122.5 billion U.S. dollars, up 34.5% year-on-year.
From January to July , the import and export trade value between China and Oceania was US$146.5 billion, up 33.1% year-on-year, accounting for 4.5% of China’s total import and export value. The export trade value was 42.6 billion U.S. dollars, up 26.8% year-on-year; the import trade value was 103.9 billion U.S. dollars, up 35.9% year-on-year.
 Source: Ningbo Shipping Exchange